ggplot provides convenient smoothing functions for fitting models to data with the built in geom_smooth and stat_smooth methods.
library(ggplot2)
(points = ggplot(data=mtcars, aes(x=hp,y=mpg)) + geom_point())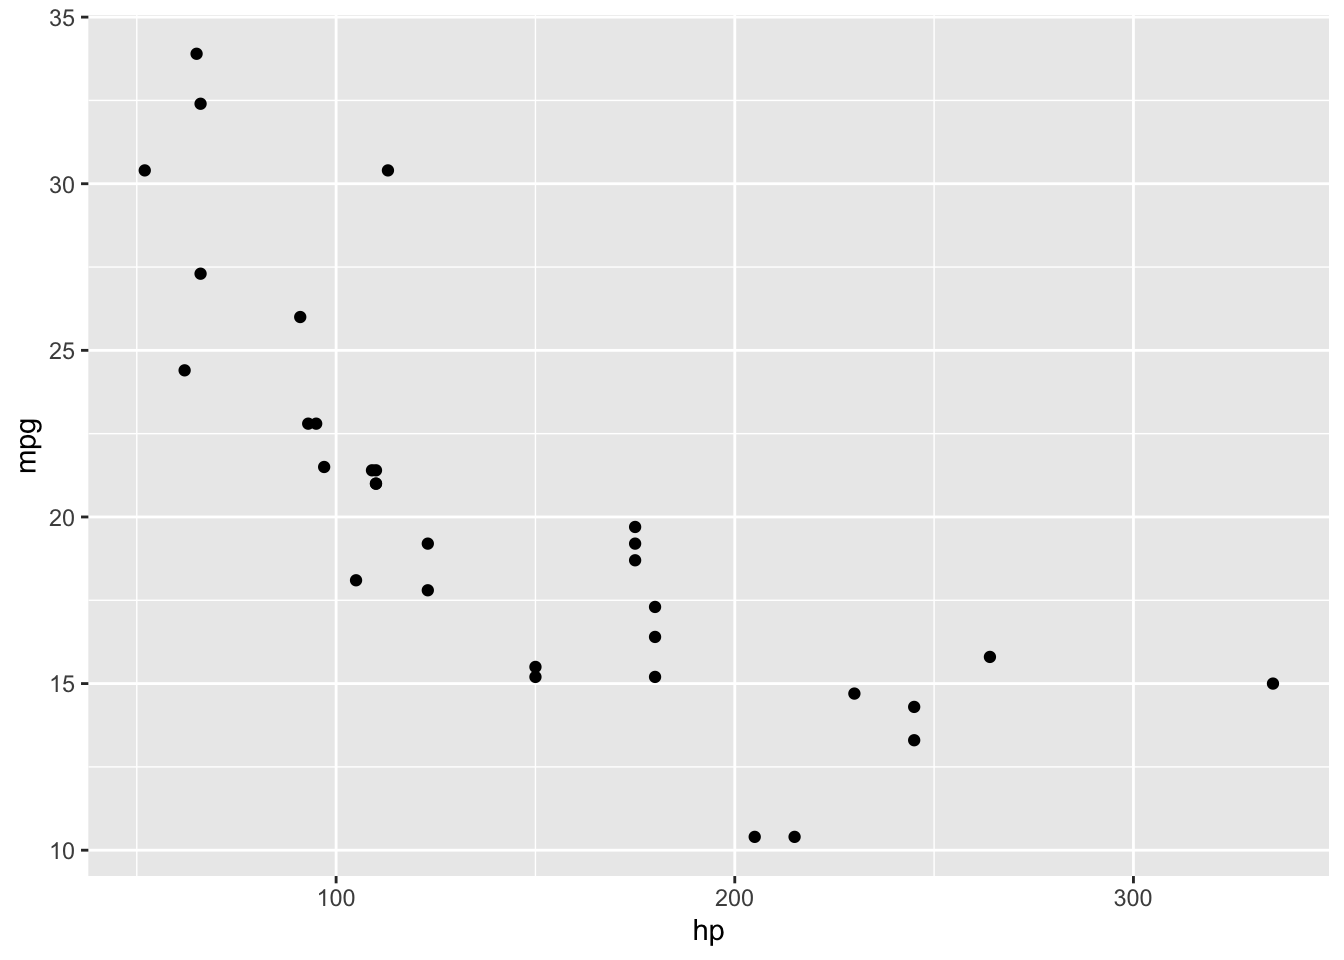
(points_smoothed = points + geom_smooth(method="lm", se=F))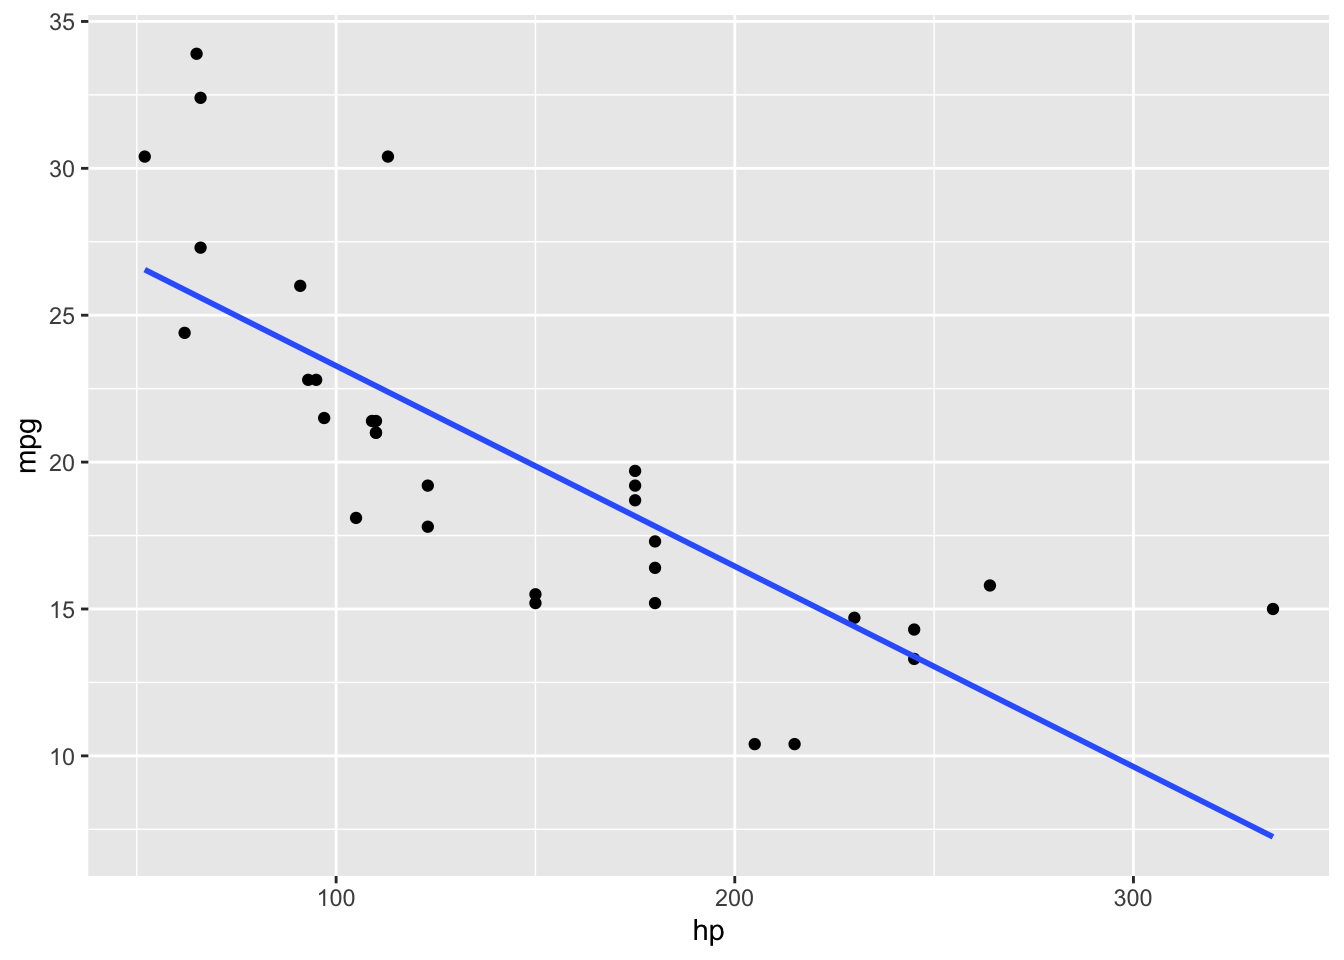
(one_facet <- points_smoothed + facet_wrap(~cyl))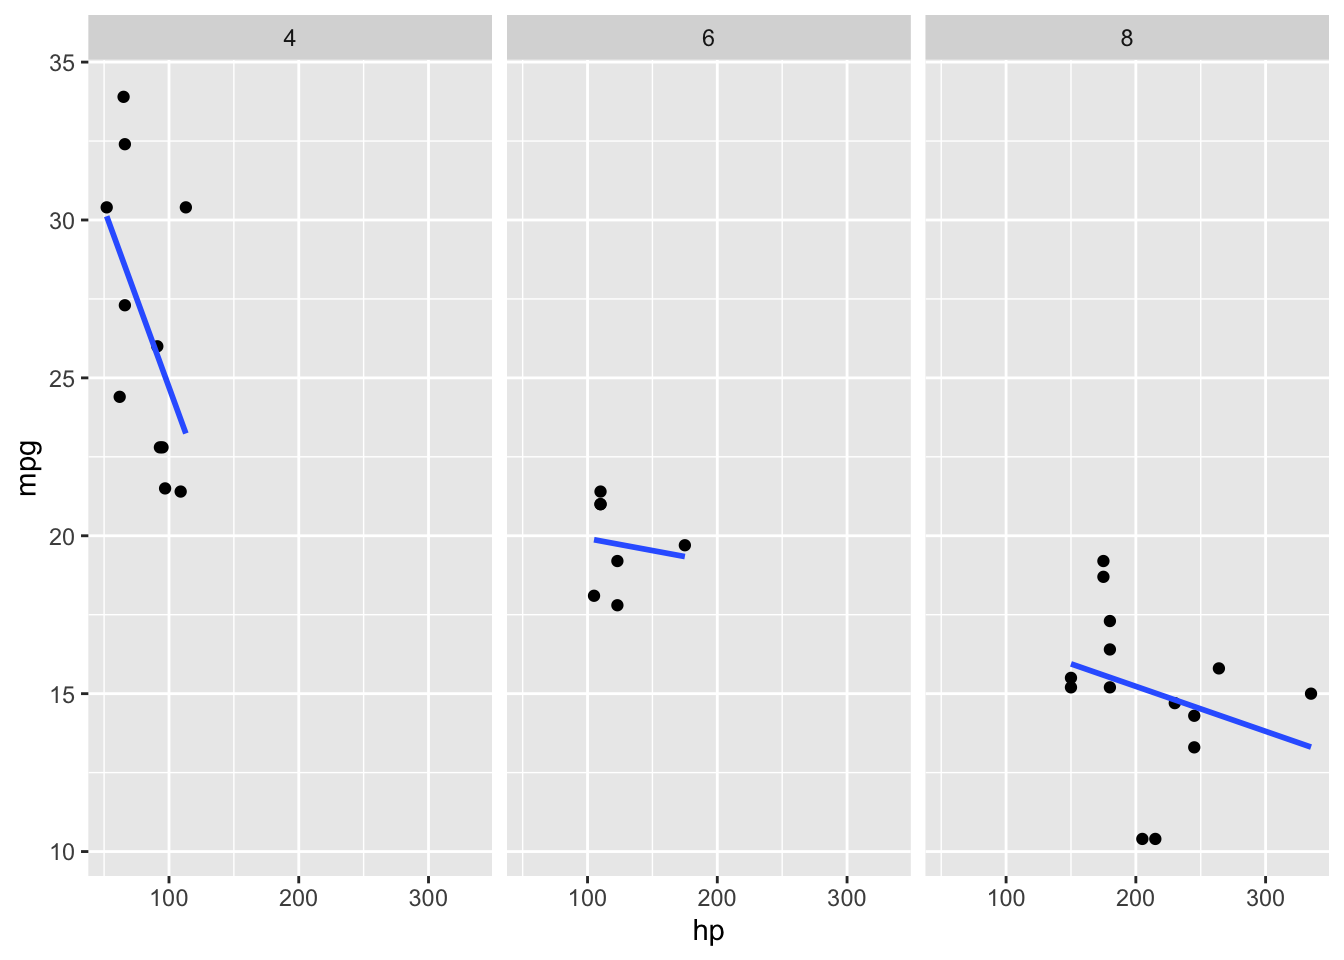 When you are faceting data, either spatially or by color/linetype/shape doing the subsetting and model fitting manually can be somewhat daunting.
(two_facet = points_smoothed + facet_grid(cyl~gear))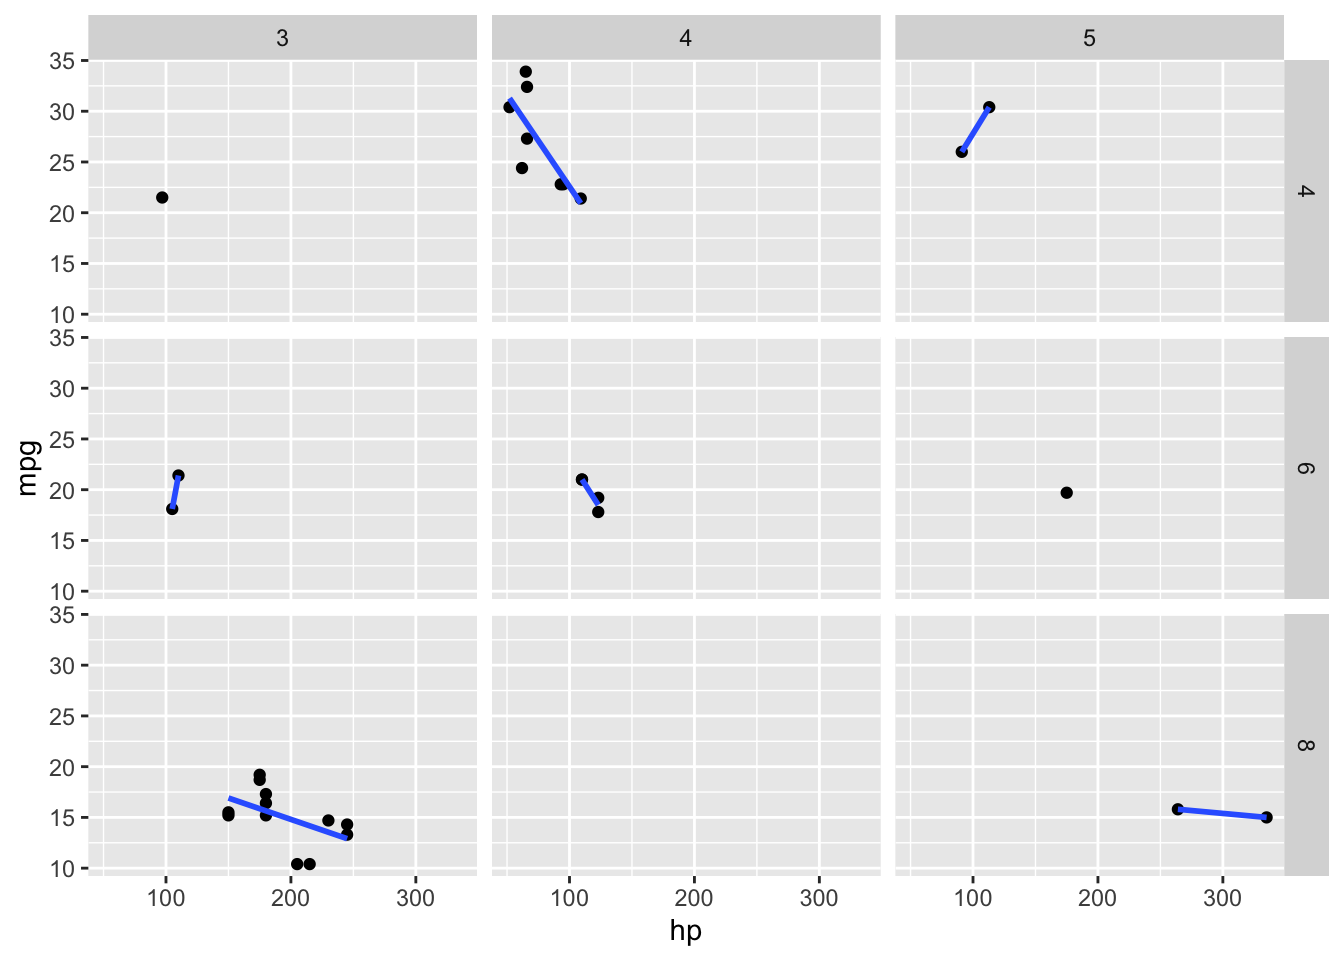 However once you understand the process, and are familiar with the plyr library of
functions it is actually very straightforward.
## One facet ##
However once you understand the process, and are familiar with the plyr library of
functions it is actually very straightforward.
## One facet ##
library(plyr)
models = dlply(mtcars, .(cyl), function(df) lm(mpg ~ hp,data=df))
predictions = ldply(models, function(mod) {
grid = expand.grid(hp=sort(unique(mod$model$hp)))
grid$pred = predict(mod,newdata=grid)
grid
})
one_facet + geom_line(data=predictions,aes(y=pred),linetype="dashed",size=2)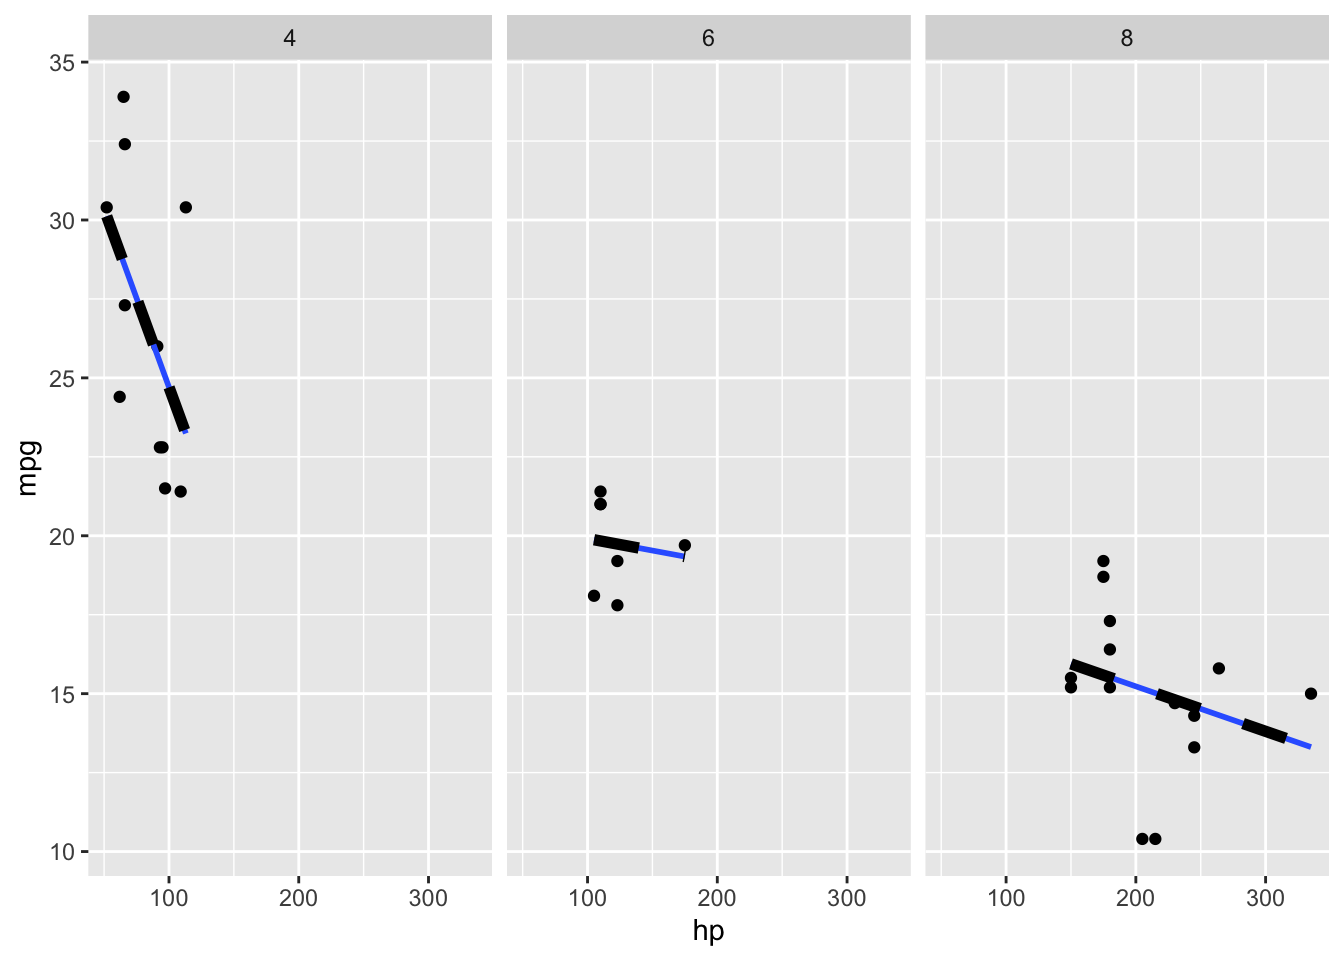 The only change for two facets is how you break up the models
## Two facets ##
The only change for two facets is how you break up the models
## Two facets ##
models = dlply(mtcars, .(cyl, gear), function(df) lm(mpg ~ hp,data=df))
predictions = ldply(models, function(mod) {
  grid = expand.grid(hp=sort(unique(mod$model$hp)))
  grid$pred = predict(mod,newdata=grid)
  grid
})
two_facet + geom_line(data=predictions,aes(y=pred),linetype="dashed",size=2)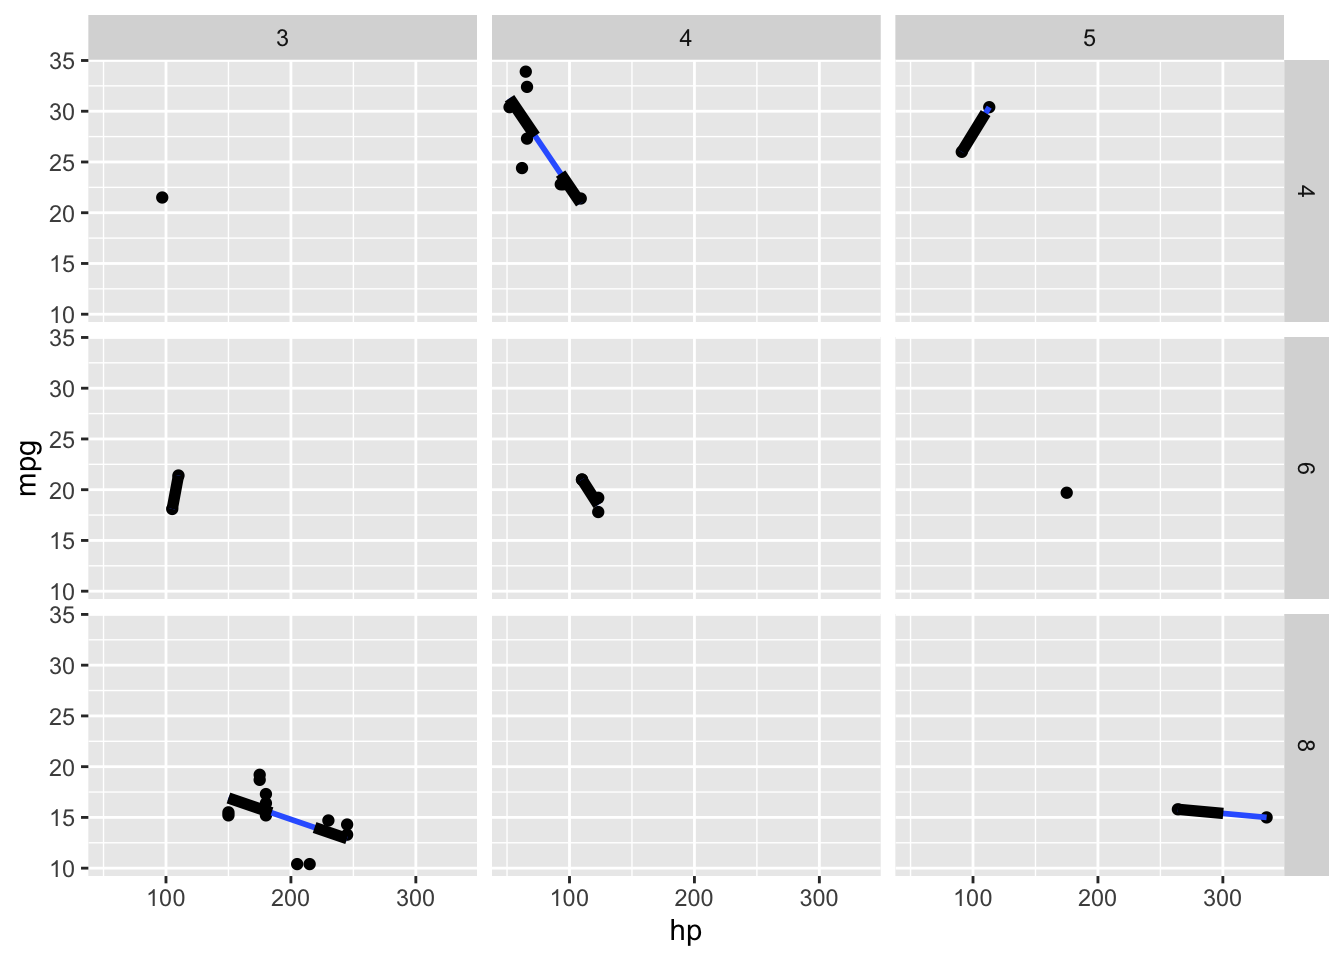
If you want to perform predictions across the full range of data you can use expand.grid with the full dataset rather than just the subset, this is analogous to the fullrange option in stat_smooth
grid = expand.grid(hp=sort(unique(mtcars$hp)))
models = dlply(mtcars, .(cyl, gear), function(df) lm(mpg ~ hp,data=df))
predictions = ldply(models, function(mod) {
  grid$pred = predict(mod,newdata=grid)
  grid
})
points +
  stat_smooth(fullrange=T,se=F,method="lm") +
  facet_grid(cyl~gear) +
  geom_line(data=predictions, aes(y=pred), linetype="dashed", size=2)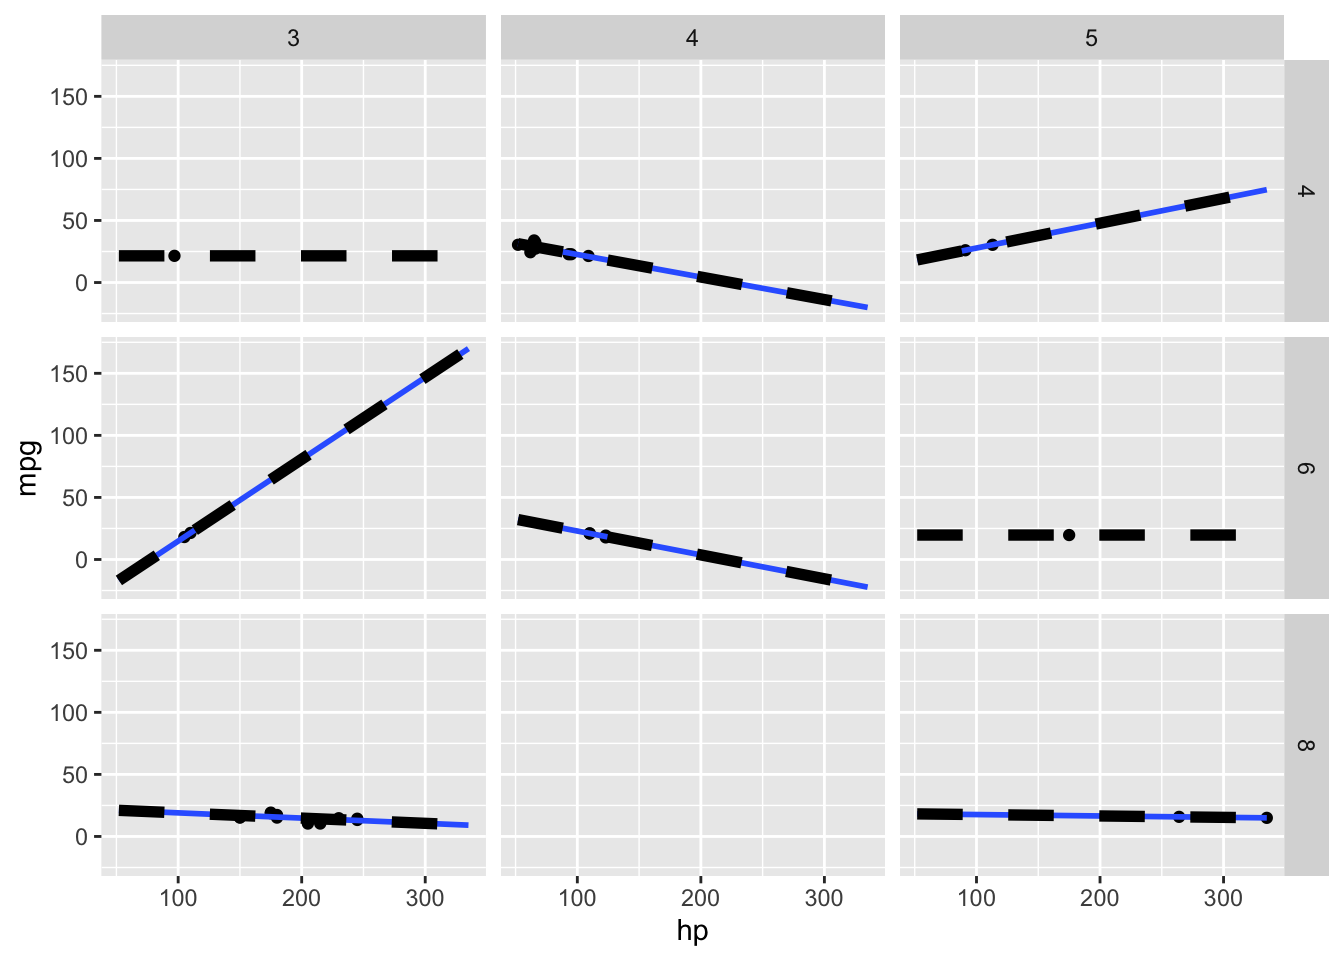
So you can see that plotting manual predictions is actually very straightforward, and this can be a powerful technique in exploratory data analysis.